In the previous part, I have introduced the problem of getting from a bitmap image of a map to interactive visualization of a map on the webpage. We now know that our goal is to create a GeoJSON file and that such a file would contain a list of polygons representing provinces of EU4. A simple example of province shape was that of the province named Bannock.
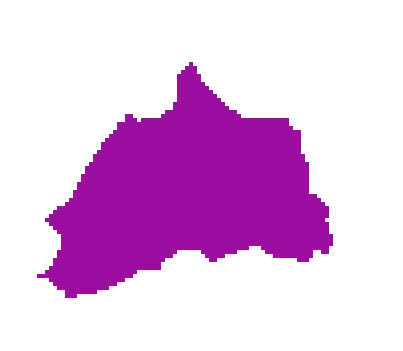
This is the simplest case where the province shape is continuous and does not contain any holes. A more complicated example from EU4 map could be the province named Kawesqar (ID: 783).

This one is much more complicated as it contains islands and holes. In terms of data representation, this province consists of multiple polygons, each of them being the border of the province. The group of such polygons defines province.
The borders of areas
When I realized that I need coordinates of borders for all provinces on the map, I have decided that it would be easier for me, if I can actually see them as thin lines on the map. In retrospect, this step probably is not required to achieve the end goal, but this article is not only about the solution but also about how I got to it and why I’ve made certain decisions.
In order to see borders of provinces on the map, we need to “hollow out” provinces, for example by changing all pixels in the bitmap to black color with the exception of the pixels which either border other province or edge of the map. As you remember each province in the provinces bitmap file has a unique color, so if the pixel is of a different color than of its neighbor it means that it is a border pixel. This allows to formulate a very simple algorithm, that can be written as follows:
foreach (Pixel in Bitmap)
   bool OnBorder = false
   foreach (NeighborPixel in Pixel.Neighbors)
      {
	if (NeighborPixel.Color != Pixel OR NeighborPixel.IsOutsideMap)
	{
	  onBorder = true
          break
        }
      }
    if (NOT OnBorder) Pixel.Color = Color.Black
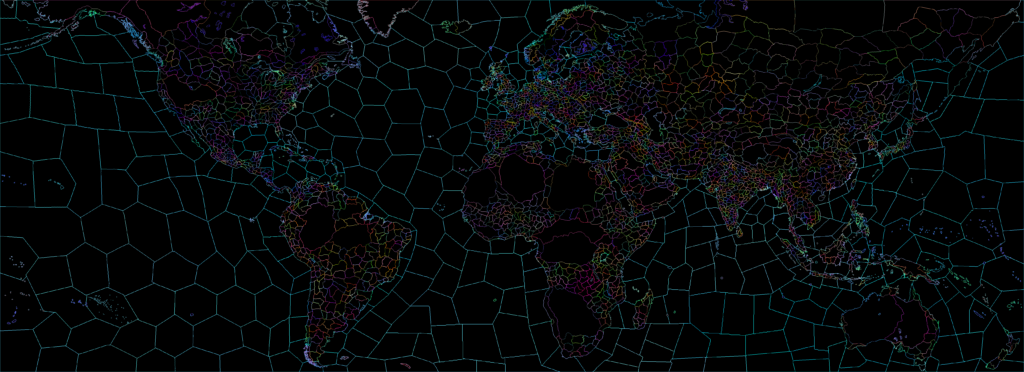
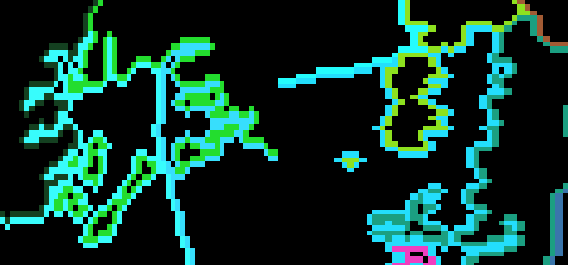
It is simple enough to run quickly (surprisingly, or unsurprisingly it completes in 42 seconds on my PC) even for quite a large bitmap. In the case of EU4, the map has 11.5 million pixels, and the file has a size of over 33 MB. The result of processing the bitmap looks quite appealing in my opinion.
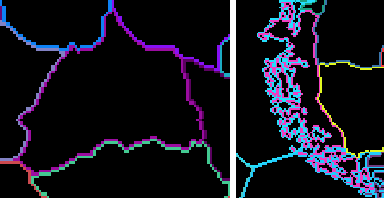
And zooming onto our Bannock and Kawesqar provinces they now look like this:
You may think that job is now done and we can prepare the GeoJSON based on this file. We have all edges nicely drawn on the map, so all we need to do is to go pixel by pixel in the same color to find out the coordinates of borders and write them into the GeoJSON file. While in theory (and probably in practice) it may work, there are three major obstacles:
- how to walk through pixels in a systematic way to recreate coordinates in the proper order
- a large number of points
- many provinces contain one pixel wide areas that are separating two other provinces
Starting with the second problem, even though we have eliminated all the non-border pixels, there are still around 700 thousand border pixels on the map. And for each of these, we need to record coordinates. I have not tried it, but my estimate is that GeoJSON file would be around 10 MB in size and drawing almost a million points separately is not optimal, especially since even a quick glance at the map makes you realize that many of the borders are straight lines, so going in 1-pixel increments is waste of computing resources. It would be much better to only save a minimal set of coordinates that will draw the polygon.
When I have started thinking about the first problem from the list I realized that walking along pixels is not as simple as one may think. In order to gather coordinates I need to:
- go through each and every colored pixel only once (this is easy)
- go through each color in order, so the coordinates are in order in which they appear on the border. Seems easy – you can go clockwise or counterclockwise, but the pixel can have anything from 1 to 7 neighbors of the same color (edge pixels) and it is not easy to decide how to decide on the proper order just by looking at some places on the map
The third obstacle is probably the most important. There are places on the map when the province is just one pixel wide, which means that if we take the coordinates of such pixel and its neighbor they form a line which is not a true representation of the original polygon. If you think about it, the true borders are formed not by pixel coordinates but in-between the pixels of different colors. This can be illustrated by following example:
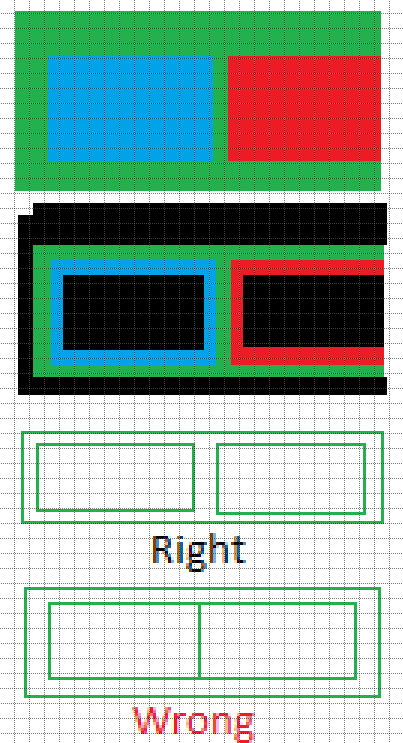
Starting from these three areas (red, green, and blue) the proper border of the green area consists of 3 rectangles. As it may not be clear from the picture the central green area is one pixel wide. The last figure you can see in the example, which is the result of directly taking coordinates of border pixels, is not two rectangles sharing one edge, but actually a non-polygon figure, at least from the perspective of GeoJSON and other vector graphic formats which expect a closed chain of lines. In other words, starting from any point on the shape you need to go back to this point by going only once through each edge of the shape. If this condition is not met the shape may not be drawn properly in all cases or in the best case it will be drawn with some edges drawn twice because if the last point on the shape is not connected by the edge to the starting point there will be a line drawn between those two points anyway.
At this point, I have started to look for some inspiration on the Internet, and the results I’ve found will be described in the next part of the series.